JRuby "IO.foreach" Performance
I’ve been spending some time dipping my toes in patch contribution for JRuby recently. I started with a few easy, isolated, spec issues, and have since been working my way into more entrenched problems. The past few weeks I spent a good bit of time toying with solutions to JRUBY-2810: “IO foreach performance is slower than MRI”. The exercise was interesting enough, that I thought it might be worth posting here. This isn’t meant to be a study of the JRuby code in particular, but more-so in the thought process of diagnosing a performance problem in foreign code.
Proof is in the Benchmark #
Performance is a very multi-faceted thing - there are so many measuring sticks (CPU, memory, I/O, startup time, scalability, ‘warm up’ time, etc). This makes quantifying a performance problem hard.
Furthermore, improvements for most performance problems typically involves making some kind of trade-off (unless you’re just dealing with bad code). The goal is to trade-off a largely-available resource for a sparse one (cache more in memory to save the CPU, or use non-blocking IO to use more CPU rather than waiting on the disk, etc).
JRuby always has a few open, standing performance bugs. It’s the nature of the beast that it is compared to MRI (the “reference” implementation), and anywhere it performs less favorably is going to be considered a bug (fast enough be damned). The performance measurement is up to the beholder, but CPU timings are generally the most popular.
JRUBY-2810 is an interesting case. IO line looping was proving to be slower than MRI Ruby; in some cases much slower. In this particular case, CPU was the closely-watched resource.
The first step I took to analyzing the problem was reproducing it. With Ruby this is usually pretty easy, as arbitrary scripts can just be picked up and executed, as opposed to Java, where all too often you have to build a special harness or test class just to expose the problem. Scripts are very natural for this, and in this particular case, the user had already provided one in the benchmarks folder that ships with the JRuby source.
Having run that file, I quickly saw the performance discrepancy reported in the bug. At this point in my experimenting, I was running inside an Ubuntu VM through VirtualBox on my Windows machine, so I think that level of indirection exasperated the numbers, so I checked my Macbook Pro as well. In both cases, the differences were significant: on Ubuntu, MRI Ruby was running the code in under 10 seconds, where JRuby was taking 30 seconds to a minute; the Macbook was still twice as slow in JRuby (12 seconds) as compared to MRI (6.5 seconds).
When faced with a big gap like this, I generally start by profiling. Running the entire process under analysis will generally grab some hotspots that need some tuning. I’m enamored with how low the barrier to entry on profiling has become on modern Java VMs (something that I think is actually a big selling point for JRuby as compared to other Ruby implementations; but I digress). To do my work here, I simply ran the benchmark, and popped open VisualVM. From there, I simply connected and performed CPU profiling (which automagically connects and injects profiling code into the running system).
In this particular case, the first problem was quickly uncovered:
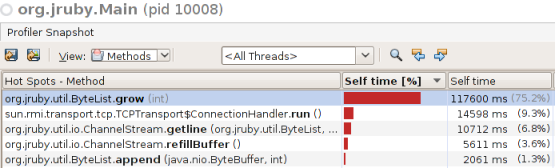
Clearly, a very large amount of time is being spent in ByteList.grow. I felt fairly fortunate at this point, as rarely is it this straightforward; having a performance problem reported with this singular of a hot-spot. When nearly 80% of the processing time is spent in a single method, it brings up several questions: What is ByteList? Why does IO.foreach use it? Why must it keeping ‘growing’? Did I leave the iron on? To answer these questions (most of them, anyway) you simply have to get your feet wet in the code.
Coding for Crackers #
At its heart, IO.foreach (and the close counterpart, each/each_line) is simply a line iterator that hands off each line of text off to a receiving block - there are a number of caveats and subtleties built into that idea, but at its core, it allows developers to write code like this:
io = #...
io.each_line do |line|
  puts line
end
Deceptively, simple - isn’t it? It turns out that a lot of wrangling has to occur to make this so simple - much of it having to do with how files are encoded, and the variety of line separators that may exist. Thankfully, the good folks at JRuby have cemented this in the code fairly decently - for my part, I mostly had to draw boxes around the complex encoding and line termination algorithms, and focus on the loop and data-reading itself. Most of this was occurring in a single method (for the code-eager, this was in RubyIO#getline and its derivatives). This method is used in a number of scenarios: the traditional looping algorithms, the 1.9 inverted enumerator stuff (handing the ownership of “next” off to the caller) as well as basic calls to ‘IO.gets’. Internally, each call to getline allocates a new ByteList and copies data from the input stream into it.
This is where the high-CPU numbers started. ByteList is simply an easier-to-use wrapper around a byte[]. It backs several JRuby data structures - the most notable probably being RubyString (the Java peer for String objects in JRuby). In fact, the ByteList allocated in this routine is eventually given to a String object, and returned at the end of the call. The ‘grow’ method on ByteList (the offending code-point) is the automatic capacity increase mechanism, and does this via an an array-allocation and copy (much like ArrayList); this method uses a fairly standard 1.5x grow factor.
It’s easy to see how ByteList would be central to the benchmark since it represents the primary data structure holding the bytes from the input source, but it seemed suspicious that ‘grow’ was the offending hotspot. I would expect it to be one of the copy methods, like ‘append’, which is really where the algorithm should be spending its time (that, and ‘read’ from the input source). To understand why ‘grow’ was so cranky, I had to look more closely at the code I was invoking: the benchmark.
Understanding the Benchmark #
The original benchmark used to test the ‘foreach’ performance in JRuby when 2810 was first opened performed something like 10,000 line iterations on a file with relatively short lines. Halfway through the life of this bug, those values were adjusted in this original benchmark in a way that exposed a short-coming in the JRuby line-read routine - by generating only 10 lines that were very, very long instead.
For any Ruby implementation, reading a file with particularly long lines using foreach is prohibitively expensive, as the entire line has to be read into memory as a single string object that is then shared with the code block. Normally, you wouldn’t want to read data this way if you knew that the file was structured so wide, and should probably consider a streamed-read instead. That being said, MRI Ruby performed much more admirably in this scenario, so it was something to be analyzed.
The root of the problem was this: JRuby was starting with an empty ByteList, and was then creating subsequently larger byte[]s indirectly (via ByteList.grow) - the 1.5x factor wasn’t enough, as the chunks were being read 4k at a time, and these files were significantly wider than 4k. For that reason alone, the ByteList was having to grow a number of times for each line, and when we’re talking about a byte[] several kilobytes in size, array copies are simply going to be expensive - all those together combine to make this an unfriendly performance proposition.
As I mentioned previously, the benchmark used to be a very different performance model. I decided at this point it was good to split the benchmark so that both could be run side by side, and I could see both the ‘wide’ scenario and the ’tall’ scenario at the same time. It turned out via profiling that the tall file was experiencing pains from ‘grow’, but not nearly so badly. Even at 10,000 lines the amount of adverse memory allocation and churn was much smaller, as a single 4k allocation on each line was more than sufficient.
For reference, here is what the ’tall’ benchmark looks like:
require 'benchmark'

MAX  = 1000
BLOCKSIZE = 16 * 1024
LINE_SIZE = 10
LINES = 10000
FILE = 'io_test_bench_file.txt'

File.open(FILE, 'w'){ |fh|
  LINES.times{ |n|
    LINE_SIZE.times { |t|
      fh.print "This is time: {t} "
    }
    fh.puts
  }
}

stat = File.stat(FILE)
(ARGV[0] || 5).to_i.times do
  Benchmark.bm(30) do |x|
    x.report('IO.foreach(file)'){
      MAX.times{ IO.foreach(FILE){} }
    }
  end
end

File.delete(FILE) if File.exists?(FILE)
The only difference in the wide benchmark is the tuning parameters:
LINE_SIZE = 10000
LINES = 10
So ’tall’ can be read as ‘10000 lines, 10 sentences long’, and ‘wide’ can be read as ‘10 lines, 10000 sentences long’.
Also for reference, here is what it looks like to run a benchmark using this framework - 5 iterations are run (as defined in the file), and the various aspects of CPU usage are measured. Generally, the most important number is the ‘real’ column when measuring performance between Ruby and JRuby, as the two report user/system CPU usage very differently.
# Running with JRuby
realjenius:~/projects/jruby/bench$ jruby --server bench_io_foreach_wide.rb
                                     user     system      total         real
IO.foreach(file)                63.970000   0.000000  63.970000 ( 63.764000)
                                     user     system      total         real
IO.foreach(file)                30.212000   0.000000  30.212000 ( 30.212000)
                                     user     system      total         real
IO.foreach(file)                30.973000   0.000000  30.973000 ( 30.973000)
                                     user     system      total         real
IO.foreach(file)                30.768000   0.000000  30.768000 ( 30.767000)
                                     user     system      total         real
IO.foreach(file)                32.813000   0.000000  32.813000 ( 32.813000)

#Running with MRI Ruby
realjenius:~/projects/jruby/bench$ ruby bench_io_foreach_wide.rb
                                     user     system      total         real
IO.foreach(file)                 0.200000   9.500000   9.700000 (  9.982682)
                                     user     system      total         real
IO.foreach(file)                 0.230000   9.430000   9.660000 (  9.889992)
                                     user     system      total         real
IO.foreach(file)                 0.560000   9.340000   9.900000 ( 10.232858)
                                     user     system      total         real
IO.foreach(file)                 0.520000   9.270000   9.790000 ( 10.054699)
                                     user     system      total         real
IO.foreach(file)                 0.600000   9.350000   9.950000 ( 10.348258)
After splitting the benchmarks, here is a breakdown of my two configurations:
| Environment | ‘wide’ MRI | ‘wide’ JRuby | ’tall’ MRI | ’tall’ JRuby |
|---|---|---|---|---|
| Ubuntu VM | 10 seconds | 30 seconds | 6 seconds | 11 seconds |
| Macbook Pro | 6.5 seconds | 12 seconds | 8 seconds | 15 seconds |
Keep in mind I’m just rounding here; not really trying to be exact for this blog post. Check the bugs for more exact numbers.
A Solution Lurks #
So, we have performance problems on tall files, and a whole lot more performance problems on wide files, particularly depending on the environment. Because of the environmental discrepencies, I spent some more time comparing the two test environments. It turned out that the Macbook Pro was simply working with a more resource-rich environment, and as such wasn’t hitting the wall as badly when allocating the new immense byte[]s. The implementation in JRuby was not degrading as well on older (or more restricted) hardware as MRI.
(It’s probably good to note here the value of testing in multiple environments, and from multiple angles)
My first pass at a solution to this problem was to consider a byte[] loan algorithm. Basically, at the start of foreach, I effectively allocated a single ByteList (byte[] container), and for each iteration of the loop, I just reused the same ByteList – eventually the byte[] being used internally would be sufficient to contain the data for each line, and would not need to grow any more (yay recycling!).
I encapsulated most of this ‘unsafe’ byte[] wrangling and copying into a small inner class called ByteListCache - at the start of the loop, the ByteListCache is created, and then it is shared for each iteration, being passed down into ‘getline’ as an optional parameter, the side effect being that the first call to ‘getline’ manually allocates a large byte[] (just like it did pre-patch), and each subsequent call can simply reuse the previously allocated byte[] that is already quite large. If the need arises to grow it more, it can, but it becomes increasingly less likely with each line.
Once the iteration is completed, the ByteListCache is dropped out of scope, ready for garbage collection. The number of calls to ‘grow’ drops dramatically with this implementation, and so did the impacts to the performance:
| Environment | ‘wide’ MRI | ‘wide’ JRuby | ‘wide’ JRuby (v1) | ’tall’ MRI | ’tall’ JRuby | ’tall’ JRuby (v1) |
|---|---|---|---|---|---|---|
| Ubuntu VM | 10 seconds | 30 seconds | 7 seconds | 6 seconds | 11 seconds | 8 seconds |
| Macbook Pro | 6.5 seconds | 12 seconds | 7 seconds | 8 seconds | 15 seconds | 9 seconds |
Unfortunately, they were only this fast because the implementation was now thoroughly broken.
Stop Breaking Crap #
Okay, so I had amazing performance numbers. Except. Now over 50 ruby spec tests were failing. Oh yeah, that might be a problem. Needless to say the problem was obvious the minute I realized what I had done (I actually woke up at 6:00am realizing this, which if you know me, is a bad sign). Remember how earlier I said that the ByteList was used as a backing store for the String? Well, at the time I implemented this, that point had eluded me. I was (accidentally) creating strings with my shared bytelist, so you can probably see where that would end up creating some significant issues with data integrity.
To fix this, the solution was simple - create a perfectly-sized ByteList at the end of the line-read the exact size necessary for the String, copying into it from the shared bytelist, and then passing it in to the String constructor. Obviously this cut into my performance numbers by a percentage on each, but it also fixed the data corruption, which is nice.
| Environment | ‘wide’ MRI | ‘wide’ JRuby | ‘wide’ JRuby (v2) | ’tall’ MRI | ’tall’ JRuby | ’tall’ JRuby (v2) |
|---|---|---|---|---|---|---|
| Ubuntu VM | 10 seconds | 30 seconds | 14 seconds | 6 seconds | 11 seconds | 10 seconds |
| Macbook Pro | 6.5 seconds | 12 seconds | 10 seconds | 8 seconds | 15 seconds | 13 seconds |
The lesson learned here, obviously, is that you need to run a variety of tests (a full suite of specs if you have them) when considering bug fixes. For JRuby, that means (at a minimum) running the specs, which is easy with the Ant script:
ant spec # or ant spec-short to just run interpreted tests
A Word on Limited Application #
Note that I isolated the use of this construct to the foreach and each_line algorithms, as these had deterministic, single-threaded behavior, and would benefit from the overhead of dealing with this additional object. The new Ruby 1.9 enumerator stuff does not use it, as there is no guarantee of single-threaded usage of the enumerator, so we can’t reuse a single byte list. Similarly, individual calls to ‘gets’ do not currently use it, for the same general reason.
Changes could be made to make this byte[] re-use more long-lasting/global - but the changes required felt a little too overwhelming for a first pass, even if they did offer potentially larger benefits.
Rinse and Repeat #
Now that I had two tests, and I had seen some improvements (but not quite in the range of MRI), it was time to revisit. Re-running the benchmarks, it was fascinating to see a new prime offender - incrementlineno. It turns out that a global variable was having to be updated through a very indirect routine that contains a fixnum representing the line number in the file, and all of this heavy-weight variable updating (going through call-sites and arg file lookups) was very expensive in comparison to the rest of the iteration.
At this point, I’d spend a lot of time explaining how I improved the performance of this little gem, however the truth be told once I hit this, I simply had to inform the powers-that-be, and back up. You see, I couldn’t figure out (for the life of me) why this method was doing what it was doing; why it was so important for this line number to be set. This is one of the perils that I have verbally discussed with folks about consuming foreign code-bases. You can’t assume secret sauce is a bad thing - I had to assume it is there for a reason, even if I don’t know what it is.
It turns out, the JRuby folks didn’t know the reason either. Well, that’s not exactly true; it didn’t take long for Charles Nutter to figure out why it was there, but it was clear it was only for rare file execution scenarios, and not appropriate for the more general looping scenarios I was debugging. To follow his efforts on how he optimized that code path, you can reference his commit here: JRUBY-4117.
After his optimizations, the numbers boosted again:
| Environment | ‘wide’ MRI | ‘wide’ JRuby | ‘wide’ JRuby (v3) | ’tall’ MRI | ’tall’ JRuby | ’tall’ JRuby (v3) |
|---|---|---|---|---|---|---|
| Ubuntu VM | 10 seconds | 30 seconds | 11 seconds | 6 seconds | 11 seconds | 8.5 seconds |
| Macbook Pro | 6.5 seconds | 12 seconds | 6.3 seconds | 8 seconds | 15 seconds | 9.5 seconds |
Summary #
I think it’s fascinating how varied the numbers are depending on the platform. This is a complicated benchmark, and as Charles Nutter mentioned to me, one problem we’ll continue to face is that we have no control element in this benchmark. You can get consistency through repetition, but there are simply too many variables to predict exactly what the outcome will be on any given platform. I find it interesting how well the Macbook handles the wide files compared to the Ubuntu VM, which just dies a slow death in comparison - this has to be a side-effect of resource starvation in the VM; but whatever the case, it’s an interesting dichotomy.
On average, the new numbers are much more competitive with MRI, even if they don’t beat it in most cases. As I learned from working with others on this bug, your mileage may vary significantly, but it’s clear from the implementation that we’re causing a lot less resource churn for very little cost (the trade off here is retained memory), and that’s generally a good sign things are going in the right direction. Certainly, profiling has shown that the effort is much more focused on reading from the input channel.
That being said, I’m sure there is more performance to be found - MRI is just a hop-skip-and-jump away!